Measuring Return on Marketing Investment: A Practical Guide to Proving ROMI
Measuring your return on marketing investment is all about drawing a straight line from your budget to your bottom line. It’s about proving, with hard numbers, that your efforts are directly fueling revenue growth.
The basic formula is simple enough: (Revenue - Spend) / Spend. But as any seasoned marketer knows, the devil is in the details—specifically, in accurately tracking revenue back to the right campaigns and making sure you've accounted for every single cost.
Beyond a Cost Center: Proving Marketing’s True Value
Let's be honest: justifying your marketing budget can feel like an uphill battle. Too often, the conversation gets stuck on costs instead of contributions. My goal here is to help you flip that script for good. We're going to reframe marketing from a line item on an expense sheet to the powerful growth engine it actually is.
It all starts by looking past the "vanity metrics." Things like likes, shares, and impressions might feel good, but they don't resonate in the C-suite. What your leadership team really cares about is pipeline, revenue, and profit. When you measure your return on investment effectively, you're translating every single marketing activity—whether it's a niche Reddit campaign or a broad digital ad push—into tangible business outcomes.
The Real Goal of Measuring ROMI
Ultimately, calculating your Return on Marketing Investment (ROMI) is about making smarter decisions. This isn’t just about creating a fancy report to prove your worth; it’s about getting crystal clear on what’s working and, just as importantly, what’s not.
Once you have that data, you can start making some real moves:
- Allocate your budget with confidence. For example, if your data shows that LinkedIn ads are generating leads at a 5:1 ROI while your Twitter ads are only at 2:1, you have a clear, data-backed reason to shift more budget toward LinkedIn.
- Optimize campaigns on the fly. Imagine you're running two versions of a Google Ad. After a week, you see that 'Ad A' has a click-through rate of 4% and has generated three demo sign-ups, while 'Ad B' has a CTR of 1.5% and zero sign-ups. You can immediately pause 'Ad B' and reallocate its budget to 'Ad A', preventing wasted spend.
- Ask for more investment with concrete proof of the financial returns you’re generating. Instead of saying "I think we need more budget," you can say, "Last quarter, every $1 we invested in SEO generated $6 in revenue. With an additional $10,000, we project we can generate another $60,000 in pipeline."
Think of it like building a financial roadmap for your marketing. It shows you exactly where you've been, how you got there, and where you should invest your resources next for the fastest, most profitable path forward.
What Is a Good Marketing ROI?
So, what number should you be aiming for? While a "good" ROI really depends on your specific industry, business model, and profit margins, industry benchmarks can give you a solid starting point.
A massive analysis by WARC, which looked at over 1,500 effective ad campaigns, found some really telling figures. On average, successful brands hit a median revenue return of 4.33:1. That means for every dollar they spent, they brought in $4.33 in revenue. The median profit ROI was a very healthy 2.5:1.
One of the most interesting takeaways? The study found that lower-budget campaigns often punched way above their weight, producing some of the highest average ROI ratios. It’s a great reminder that a smart, targeted strategy can easily outperform a massive budget. You can dig deeper into these advertising ROI benchmarks to see how you might stack up.
The most powerful shift happens when marketing is no longer seen as a cost to be minimized, but as an investment to be optimized. Accurate ROMI measurement is the bridge that makes this shift possible, turning data into a compelling story of growth and profitability.
To get started, you'll need a few key pieces in place. Think of this as your foundational toolkit for building a reliable measurement system.
Your Starting Toolkit for Measuring Marketing ROI
Here’s a quick look at the essential components you need to start measuring your marketing's financial impact accurately.
| Component | What It Is | Why It's Critical for ROI |
|---|---|---|
| Clear Objectives & KPIs | The specific, measurable goals you want your marketing to achieve (e.g., generate 500 MQLs, achieve a 5:1 ROMI). | Without a target, you can't measure success. This aligns your team and defines what "good" looks like. |
| Attribution Model | The rule or set of rules that determines how credit for sales and conversions is assigned to touchpoints in a customer's journey. | This is how you connect marketing activities to revenue. The model you choose directly impacts your ROI calculations. |
| Tracking Instrumentation | The technical setup for collecting data, like UTM parameters, event tracking (e.g., button clicks), and conversion pixels. | This is the plumbing of your measurement system. Without it, you're flying blind and can't collect the raw data you need. |
| Analytics & CRM Platforms | Tools like Google Analytics 4 and a CRM (e.g., HubSpot) that collect, organize, and visualize your data. | These platforms bring all your data together, allowing you to connect marketing touchpoints with actual sales data from your CRM. |
Getting these four components set up correctly is the first, most crucial step. It lays the groundwork for everything else, ensuring the data you collect is clean, accurate, and ready for analysis.
Building a Rock-Solid Tracking Foundation
Before you can even think about calculating your return on marketing investment, you need data you can trust. Let's be honest: without a solid tracking foundation, any ROI calculation is just a guess. It's built on a shaky base of incomplete or inconsistent information, and that's how you fall into the classic "garbage in, garbage out" trap that derails so many marketing analyses.
This foundational work isn't the glamorous part of marketing, but it's single-handedly the most important step. It’s the behind-the-scenes plumbing that makes every dashboard, report, and strategic decision meaningful.
This diagram breaks down the basic flow of turning marketing spend into measurable results.
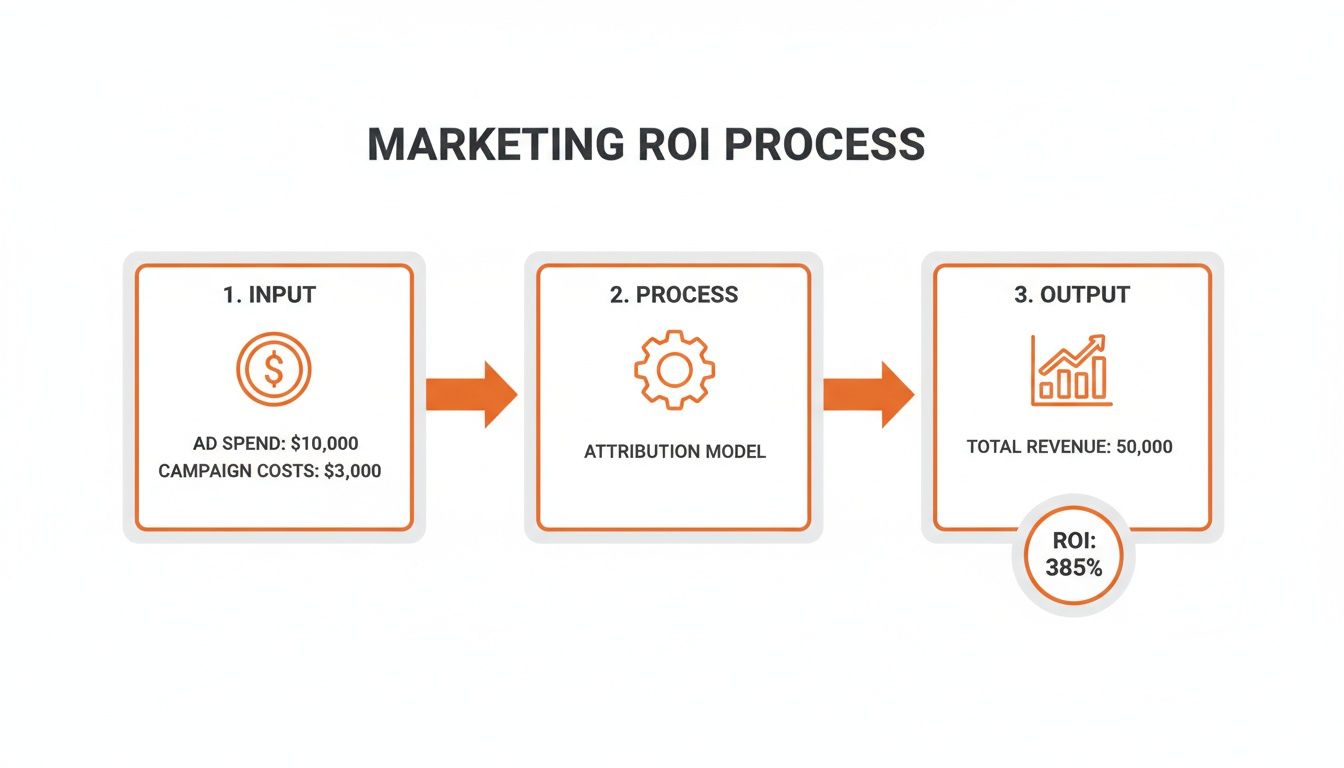
As you can see, clean inputs are the only way to get a trustworthy output. That all starts with meticulous tracking from day one.
Mastering UTMs for Clear Attribution
I can't overstate this: Urchin Tracking Modules, or UTMs, are the bedrock of good attribution. These small text snippets added to your URLs are what tell your analytics tools exactly where your traffic is coming from. Without them, all your referral traffic gets lumped into one big, useless bucket, making it impossible to know if a click came from a paid Reddit ad or an organic mention in a comment.
Consistency is everything. A messy UTM strategy creates more problems than it solves. For instance, if you use utm_source=reddit on one campaign and utm_source=Reddit on another, your analytics tool will see them as two separate sources. Your data gets split, your reports are a mess, and your analysis is compromised.
The fix is simple: create a standardized naming convention and make sure your entire team uses it. A shared Google Sheet template works perfectly for this.
Practical Example: A Reddit Campaign
Let's say you're launching a paid campaign on Reddit for a new product. A properly structured URL would look something like this:yourwebsite.com/product-launch?utm_source=reddit&utm_medium=cpc&utm_campaign=q2-product-launch&utm_content=video-ad-a
Here’s the breakdown:
utm_source=reddit: Clearly identifies the platform. No ambiguity.utm_medium=cpc: Specifies this is a paid click (cost-per-click).utm_campaign=q2-product-launch: Groups all activity for this specific initiative together.utm_content=video-ad-a: This lets you A/B test creatives. You can see how this video ad performs againstimage-ad-b.
This level of detail lets you see not just that Reddit drove traffic, but that your Q2 product launch campaign—and specifically video ad A—generated X number of leads or $Y in revenue. That's actionable insight.
Defining and Tracking Key Conversion Events
Once you know where users are coming from, you need to know what they're doing. A "conversion" isn't just a final sale. It’s any valuable action that moves someone closer to becoming a customer. Defining these events in your analytics platform, whether it's Google Analytics 4 (GA4) or Mixpanel, is critical.
Think of these as leading indicators. These "micro-conversions" give you early signals on campaign performance long before revenue hits the books, which is especially important if you have a long sales cycle.
Here are a few real-world examples of conversion events you should be tracking:
- For a B2B SaaS Product:
demo_request_submittedwhitepaper_downloadpricing_page_view
- For an E-commerce Brand:
add_to_cartbegin_checkoutnewsletter_signup
By tracking these, you can measure the impact of your marketing at different stages of the funnel. You might find that one channel is great for generating initial interest (newsletter_signup), while another is a powerhouse for driving high-intent actions (demo_request_submitted).
A robust tracking plan doesn't just measure the end of the journey; it illuminates every critical step along the way. This granular insight is what transforms data from a simple report card into an actionable roadmap for growth.
Installing Pixels for a Multi-Channel View
Customer journeys are messy. Someone might see your ad on LinkedIn, get hit with a retargeting ad on Meta (Facebook/Instagram) a few days later, and then finally search for you on Google to make a purchase. To see the whole picture, you need tracking pixels from these ad platforms on your website.
A tracking pixel is just a small piece of code that tracks user behavior on your site. This data feed allows platforms like Meta and LinkedIn to see which conversions came from their ads. It’s essential for three reasons:
- Accurate Conversion Tracking: You can finally see which ads are actually leading to on-site actions.
- Building Retargeting Audiences: This is how you create those powerful audiences of users who visited your pricing page but didn't sign up.
- Optimizing Ad Delivery: The platforms' algorithms use this conversion data to find more people like your existing customers.
Implementing these pixels correctly ensures you capture the full value of your multi-channel strategies. It’s how you start to understand how different platforms work together, giving you the data you need to make smarter budget decisions across your entire marketing mix.
How to Choose the Right Attribution Model
Attribution isn't about finding a single, perfect answer that proves one marketing channel gets all the glory. Think of it as a lens. Your job is to pick the right lens to bring the real story of what drives conversions into focus. This isn't a one-and-done decision; it's about landing on a framework that gives you solid, directional insights right now, so you can stop guessing and start making smarter bets with your marketing budget.
The model you choose has a ripple effect on every single ROMI calculation you make, so it's a decision worth getting right.
First-Touch and Last-Touch: The Simplest Views
The most straightforward models, and often the best place to start, are First-Touch and Last-Touch. They’re easy to get your head around and simple to set up, which is why so many businesses lean on them initially.
First-Touch attribution gives 100% of the credit to the very first interaction someone has with your brand. This model is your best friend if your main goal is top-of-funnel demand generation. It helps you answer the question, "Which of our channels are best at bringing new people into our world?"
On the flip side, Last-Touch attribution gives all the credit to the final click before a conversion. This is the go-to for performance marketers who need to know which channels are the closers. It answers, "What's pushing customers over the finish line right now?"
Practical Example: A DTC Flash Sale
Imagine a direct-to-consumer apparel brand running a 48-hour flash sale. They’re blasting it out on Instagram with a clear "Shop Now" link. For a short, impulse-buy campaign like this, a Last-Touch model works beautifully. It tells them exactly how many sales came directly from that Instagram click, giving them a clean, immediate read on the campaign's success.
Multi-Touch Models for More Complex Journeys
Let's be real—most customer journeys are messy. A buyer might find you through a blog post (first touch), get hit with a retargeting ad a week later, and finally buy after clicking a link in your email newsletter (last touch). Single-touch models completely miss those crucial middle steps.
This is where multi-touch attribution models come in to paint a fuller picture. They work by spreading the credit across multiple touchpoints.
- Linear Model: This is the "everyone gets a trophy" model. It gives equal credit to every single interaction in the customer's journey. It’s a simple way to acknowledge that every touchpoint played some part.
- U-Shaped (Position-Based) Model: This one gives 40% of the credit to the first touch and 40% to the last touch, then splits the remaining 20% across all the interactions in between. It puts the most value on the channels that start the conversation and those that seal the deal.
The screenshot below from Google Analytics shows just how much the story can change depending on the model you use.
Notice how "Paid Search" hogs all the credit in the Last-Click model? But when you switch to other models, you see that "Email" and "Social Network" were also doing important work earlier in the journey.
Attribution is a journey toward clarity, not a destination of perfection. The goal is to choose a model that accurately reflects your typical customer journey, giving you the confidence to invest your marketing dollars more effectively.
Advanced Models: Data-Driven Attribution
The most sophisticated approach is Data-Driven Attribution (DDA). This model, now standard in platforms like Google Analytics 4, uses machine learning to sift through all your conversion data. It compares the paths of customers who converted with those who didn't, then assigns credit based on how much each touchpoint actually contributed to the outcome.
Instead of being stuck with a fixed rule (like 40% for the first touch), DDA builds a custom model based on your specific data. It's the most accurate way to measure your marketing return because it truly adapts to your business and your customers' behavior.
Practical Example: A B2B SaaS Company
Think about a B2B software company with a six-month sales cycle. A prospect might first see a LinkedIn post, download a whitepaper two months later, attend a webinar, and finally request a demo after seeing a targeted ad.
For a long, winding journey like this, a U-shaped model is a solid choice. It rightly gives props to both the initial LinkedIn post that sparked awareness and the final ad that prompted the demo request. But an even better choice would be a Data-Driven model. It might uncover that the webinar was actually the most pivotal moment in moving that prospect from just looking to seriously buying.
Which Attribution Model Fits Your Business?
Choosing the right attribution model is all about matching the model to the reality of your customer's journey. There's no single "best" option—only the best option for you. This table breaks down the common models to help you find the right fit.
| Attribution Model | Best For These Scenarios | What It Might Miss |
|---|---|---|
| First-Touch | Businesses focused on top-of-funnel growth and brand awareness. Great for understanding which channels bring in new prospects. | The channels that nurture and close the deal. It can overvalue discovery channels. |
| Last-Touch | Short sales cycles and performance marketing campaigns where the final call-to-action is key (e.g., e-commerce flash sales). | All the brand-building and consideration touchpoints that happened before the final click. |
| Linear | Longer sales cycles where you want to give credit to every interaction that kept the lead warm. A good, balanced starting point for multi-touch. | It treats all touchpoints as equal, when in reality, some are more influential than others. |
| U-Shaped | Businesses where both the first interaction (discovery) and the last interaction (conversion) are considered highly important. | The "messy middle"—the nurturing and consideration phases can feel undervalued. |
| Data-Driven | Businesses with enough conversion data (usually 300+ conversions/month) for the algorithm to work effectively. The most accurate model. | It’s a "black box" model, so it can be harder to explain why it assigns credit the way it does. Requires sufficient data volume. |
Ultimately, the model you pick should give you a clearer, more honest look at what’s working. It’s the foundation for making confident, data-backed decisions about where to put your next marketing dollar.
Crunching the Numbers: How to Calculate ROMI and Find Long-Term Value
Alright, you've done the hard work of setting up your tracking and attribution. Now for the fun part—turning all that data into a clear picture of your return on marketing investment. This is where we go from simply counting clicks to understanding the real financial impact of every dollar you spend.
It all starts with the classic ROMI formula. It's your quickest, most direct way to see if a campaign is profitable.

The Foundational ROMI Formula
At its core, Return on Marketing Investment (ROMI) answers one simple question: For every dollar we put in, how many dollars did we get back?
The formula couldn't be more straightforward:
ROMI = (Revenue from Marketing - Marketing Spend) / Marketing Spend
Let’s make this real. Imagine you launched a new Reddit ad campaign that cost you $5,000 last month. Your tracking confirms that this campaign directly brought in $25,000 in sales.
Here’s the math:
($25,000 - $5,000) / $5,000 = 4
This gives you a 4:1 ratio, or a 400% ROMI. In plain English, for every $1 you spent on that Reddit campaign, you made $4 back. That’s a powerful number you can confidently share with anyone in your company.
For context, it helps to know what a "good" return looks like. On average, digital marketing channels see about a $5 return for every $1 spent. A 2024 survey of marketers revealed that Facebook led the pack for 28% of them, with Instagram close behind at 22%.
Looking Beyond the First Sale with LTV-Adjusted ROMI
The basic ROMI formula is a great snapshot, but it has a massive blind spot: it only cares about the first purchase. What about the customers who stick around, buying from you over and over again? This is where Customer Lifetime Value (LTV) completely changes the game.
LTV is the total amount of money a customer is expected to spend with you over their entire relationship with your brand. When you factor LTV into your ROMI, you get a much more honest and insightful look at a campaign’s true value.
A campaign that seems mediocre based on initial sales might actually be your golden goose if it's bringing in loyal, long-term customers. This is particularly crucial for SaaS companies or any e-commerce brand that relies on repeat business.
Relying only on first-purchase ROMI is like judging a movie by its opening scene. You get a glimpse, but you miss the whole story. LTV shows you the full picture.
Calculating an LTV-Adjusted Return
Bringing LTV into the equation shifts your focus from quick wins to sustainable, long-term growth. The formula gets an upgrade:
LTV-Adjusted ROMI = (LTV Attributed to Marketing - Marketing Spend) / Marketing Spend
You can calculate a simple LTV with this formula:
LTV = Average Purchase Value x Average Purchase Frequency x Average Customer Lifespan
For instance, say your average customer spends $100 per order, buys 3 times a year, and typically remains a customer for 2 years. Their LTV would be $600. Now, when you acquire a customer like that from your $5,000 Reddit campaign, the ROI looks vastly different. If you want to see how this fits into a broader growth plan, our guide on effective demand generation strategies connects these dots.
Tying It All Together with the LTV:CAC Ratio
The final piece of this puzzle is comparing your LTV to your Customer Acquisition Cost (CAC)—the total amount you spend on sales and marketing to get one new customer.
The LTV:CAC ratio is one of the most critical metrics for understanding the health and scalability of your business. It tells you exactly how much value you're creating for every dollar spent on acquisition.
- Calculating CAC: Just divide your total marketing spend by the number of new customers you got. For example, $5,000 spend / 50 new customers = $100 CAC.
- Finding the LTV:CAC Ratio: With a $600 LTV and a $100 CAC, your ratio is a fantastic 6:1.
As a rule of thumb, a healthy LTV:CAC ratio is 3:1 or higher. If it’s below 1:1, you're literally losing money on every customer. A high ratio like 6:1 is a sign of a very efficient and profitable marketing machine. For more on the practical side of this, check out this a comprehensive guide to measuring marketing ROI that breaks down the process.
Tackling Hard-to-Measure Channels Like Reddit
Measuring your marketing return is pretty straightforward when you're looking at channels like PPC or email. A click leads to a conversion, and you can draw a clean line between the two. But what do you do when the value isn't in a click, but in a conversation?
That's the core challenge with community-driven platforms like Reddit. Authentic engagement is the name of the game, and it rarely follows a direct-response path. So, how do you measure the ROI of a platform built for community, not just for clicks? The key is to get creative and blend hard data with more qualitative insights to see the whole story.
Blending Quantitative and Qualitative Signals
Direct attribution on Reddit is tough, but it’s far from impossible. You just have to start with what you can track.
Be disciplined with your UTM parameters on any link you share in posts or comments. This will give you a baseline for any direct-response traffic you generate. The numbers might seem small at first, but it’s your starting point.
The real value, though, is often hiding in plain sight, just beyond the reach of those UTMs. You have to learn to look for correlations and other signals.
- Watch for "Dark Social" Spikes: Let's say one of your comments gets 500 upvotes in a niche subreddit. Did you see a corresponding lift in direct traffic or branded search queries in the following 24-48 hours? That unattributed traffic is often Reddit’s invisible hand at work.
- Track Brand Mentions: Use a tool like F5Bot or even simple Google Alerts to monitor mentions of your brand. A sudden jump in positive conversations about your product across different subreddits is a powerful indicator of growing brand equity—a critical, if less tangible, part of your long-term ROI.
Adding Simple, Human-Powered Attribution
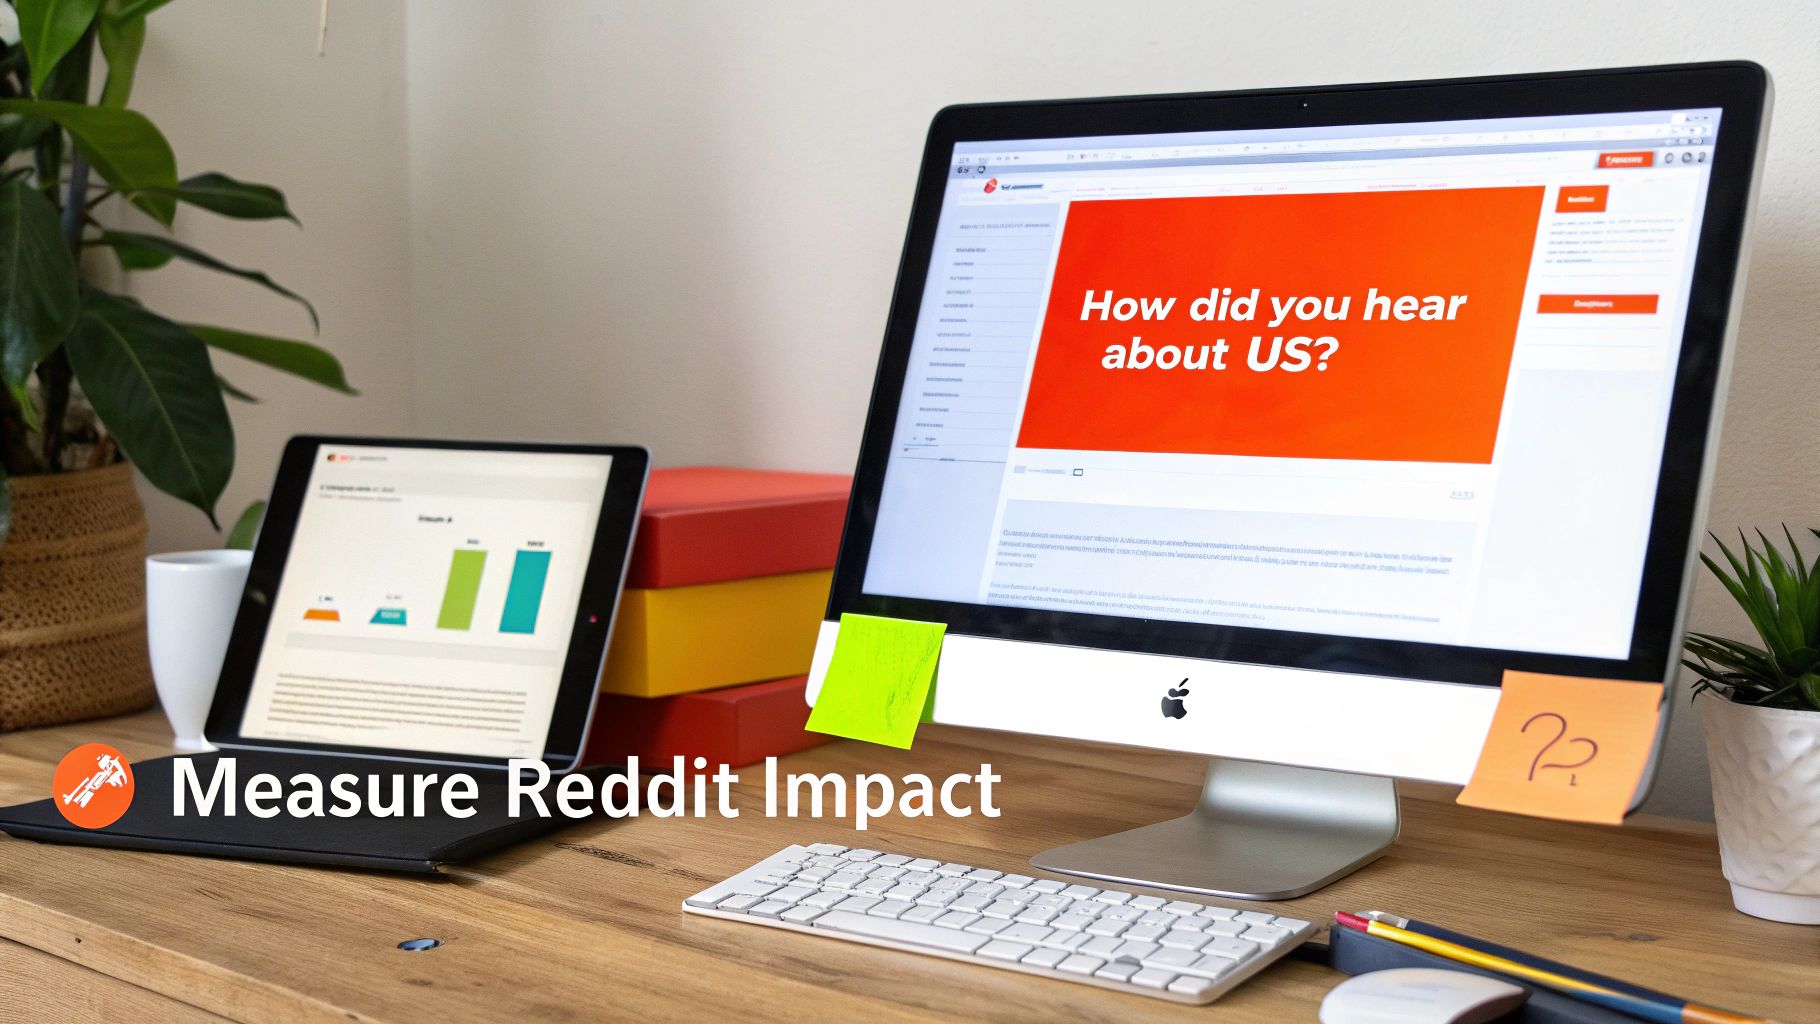
Sometimes the best solution is the most straightforward. Since your tracking tools can’t see everything, why not just ask your customers directly?
One of the most powerful tools for measuring Reddit's impact is a single, open-ended question on your signup or checkout form: "How did you hear about us?" You'll be amazed at how many people will tell you they "saw a comment on r/SaaS" or "someone recommended you on Reddit."
This self-reported attribution becomes your secret weapon. It’s the missing link that connects your community engagement efforts to actual revenue, proving the value of conversations that a UTM parameter will never catch. If you want to build a more formal strategy around this, check out these community engagement best practices.
A Practical Scenario Tracing Reddit ROI
Let’s put this into practice. Imagine you're a B2B SaaS founder. One of your engineers spends a little time each week in r/devops, offering genuinely helpful advice. In one comment, she casually mentions how your tool solved a specific, annoying problem she was facing. The comment gets real traction.
Over the next two weeks, you notice a few things:
- A 15% increase in direct traffic to your site.
- A spike in Google searches for "[Your Brand Name] vs [Competitor]."
- Five high-quality enterprise leads sign up for a demo. When the sales team follows up, four of them say they found you because of "a Reddit comment."
Without that simple question, you'd be scratching your head about where those valuable leads came from. With it, you can trace a significant pipeline boost directly back to a single, authentic interaction on Reddit. It proves that building trust and brand equity on the platform translates directly into measurable business results. It’s just a different way of thinking about ROI.
Common Questions About Measuring Marketing ROI
Even with a solid framework, some questions always pop up the minute you start trying to measure your marketing return. This is where the theory hits the road, and you're faced with the messy reality of your own data. Let's dig into some of the most common hurdles I see marketers face when they move from planning to execution.
Answering these practical questions is key. It helps you build confidence and makes sure your measurement strategy actually drives decisions instead of just living in a spreadsheet.
How Often Should I Calculate Marketing ROI?
The honest answer? It completely depends on the rhythm of your business and how long it takes to make a sale. There’s no magic number here, but you can find the right cadence by matching your reporting to your decision-making speed.
For a fast-moving e-commerce brand, you’ll probably want to look at campaign-level ROI on a weekly or even bi-weekly basis. This lets you make quick calls on ad creative, targeting, and where you're putting your money.
But for a B2B company with a three-to-six-month sales cycle, a weekly ROI report on closed deals would be totally useless. Instead, you'd be better off with a monthly review of leading indicators like MQLs and pipeline value, saving the deep dive on closed-won ROI for a quarterly business review.
The goal isn't just to measure for the sake of measuring. It's to establish a regular cadence that lets you make timely, informed decisions without getting lost in the noise of daily ups and downs.
What Are the Essential Tools for Measuring ROMI?
You don't need a massive, expensive tech stack to get started. I've seen teams get incredibly far with just a few core tools that form the bedrock of any good measurement system.
At a bare minimum, you'll need:
- A web analytics platform like Google Analytics 4 (GA4) to see what’s happening on your site—traffic, user behavior, and conversions.
- Your CRM (think HubSpot or Salesforce) to act as the single source of truth for leads, pipeline, and actual revenue.
- A spreadsheet tool like Google Sheets or Microsoft Excel to pull everything together and run your first ROMI calculations.
As you get more sophisticated, you can layer on tools like Looker Studio for data visualization or a Customer Data Platform (CDP) to stitch your data sources together automatically. But honestly, those three essentials are more than enough to build a powerful ROI reporting framework from scratch.
Should I Include Team Salaries in My Marketing Spend?
This is a great question, and it really gets to the heart of how deep you want to go. The short answer is: for a truly accurate picture, yes, you should. This gives you what’s called a "fully loaded" ROMI.
A fully loaded calculation includes the proportional cost of your marketing team's salaries, benefits, and even the software they use. An easy way to approximate this is to add up the total marketing team cost for a given period and tack it onto your direct campaign spend.
That said, most teams start by focusing only on campaign-level ROI, which just looks at direct costs like ad spend. This approach is much simpler and is perfect for isolating the performance of specific channels or initiatives. Starting here is perfectly fine; you can always evolve to a fully loaded model down the road.
What Do I Do If My Marketing ROI Is Negative?
First off, don't panic. A negative ROI isn’t a sign of failure—it's just data telling you something isn't working as planned. Think of it as a starting point for a diagnosis, not a reason to pull the plug on everything.
When you see a negative return, it's time to play detective. Break the campaign down to find the weak link:
- Low Click-Through Rates (CTR)? The problem is likely your ad creative, copy, or you're talking to the wrong audience.
- Low Landing Page Conversion Rate? The issue could be the offer itself, the page design, or a jarring disconnect between your ad and the landing page.
- High Cost-Per-Click (CPC)? This might mean you're in a super competitive space, and you need to get more creative with your targeting to find a less crowded niche.
Use that negative ROI as a reason to run structured tests. Try out new audiences, experiment with different ad copy, and A/B test your landing pages. Some of the best lessons I've learned came from early experiments that completely bombed, because they showed me exactly what not to do. Just be careful that the data isn't tricking you; our guide on avoiding misleading statistics can help you read the numbers correctly.
Ready to turn your Reddit engagement into measurable growth? Reddit Agency helps brands build authentic communities and drive real business results. We'll help you craft a strategy that connects your posts and comments directly to traffic, leads, and paying customers. Learn more at https://redditagency.com.