Lead Generation Key Performance Indicators: Measure Campaign Success and Revenue
When we talk about lead generation key performance indicators, we're really just asking one simple question: "How do we know if our marketing is actually working?" These are the specific numbers that tell you how effective and efficient your campaigns are at bringing in new prospects for your business.
KPIs give you the hard data on everything from that first click to the final cost of landing a paying customer. This information is what allows you to track your performance, make smart adjustments, and prove that your marketing budget is well spent.
Moving Beyond Volume with Smarter KPIs

It’s time to stop just counting leads and start making your leads count. We've all been there—getting caught up in metrics that look fantastic on a report, like a spike in website traffic or a huge number of email sign-ups. But those numbers often hide the real story about your business's health.
The big shift for successful marketers is moving from measuring 'how many' leads you get to 'which' leads actually turn a profit. Think of it like a fishing trip. You could catch a hundred tiny minnows, or you could land one massive prize fish. We’re here to help you focus on the prize fish by tracking the right lead generation key performance indicators.
From Vanity Metrics to Revenue Signals
The only metrics that truly matter are the ones that tie your marketing efforts directly to the bottom line. A high lead count might feel like a win, but if none of those leads ever buy anything, it’s just a number. To make this shift, having a solid grasp of what is lead generation marketing is the essential first step to building a real sales pipeline.
For B2B marketers, the quality of a lead has become the gold standard. In fact, a striking 52% of B2B marketers now say that lead quality gives them the most insight into how their content is performing—more than any other metric. This isn’t just a trend; it's a fundamental change in how we define success. We're prioritizing prospects who are ready to convert, not just filling the funnel with noise. You can dig into more of this data in this report on lead generation statistics.
The goal isn't to generate the most leads; it's to generate the most profitable customers. This distinction is the bedrock of a scalable and sustainable growth strategy.
By focusing on KPIs that signal real revenue growth, your team can:
- Justify Marketing Spend: Clearly show how every dollar of your budget contributes to sales.
- Align Sales and Marketing: Give both teams a shared language and common goals to rally around.
- Optimize for Profitability: Use data to make smarter decisions that boost efficiency and ROI.
This guide will walk you through the essential KPIs that your CEO and sales team actually care about. To put these metrics into action, we also recommend checking out our article on lead generation best practices to round out your strategy.
Top-Funnel Metrics for Audience Engagement

Before a single lead comes your way, you have to earn people's attention. The very top of your funnel (ToFu) is all about grabbing that initial interest and seeing how far your brand's message is traveling. Think of these early KPIs as your canary in the coal mine—they tell you if your content is actually connecting with your audience long before you even think about asking for an email.
These metrics are like the first handshake. They won't close the deal, but they’ll absolutely tell you if the conversation is starting on the right foot. When these numbers look good, it's a solid sign that your creative, your copy, and your targeting are all in sync.
Click-Through Rate (CTR)
Your Click-Through Rate (CTR) is probably the most straightforward way to see if your ad or post is compelling. It answers a simple but vital question: Of all the people who saw your message, how many were intrigued enough to actually click on it? A high CTR is a fantastic signal that your headline and visuals are doing their job.
The formula couldn't be simpler:
CTR = (Total Clicks / Total Impressions) x 100
Practical Example: If your Reddit ad gets shown 10,000 times (impressions) and pulls in 300 clicks, your CTR is a solid 3%. Actionable Insight: If you’re running a campaign and your CTR is dismal, that’s a red flag. Before you scrap the campaign, try A/B testing your headline. A simple change from "Our New Software" to "Stop Wasting Time on Manual Reports" could be the difference between a 0.5% CTR and a 2.5% CTR because it speaks directly to a user's pain point.
Cost Per Click (CPC)
While CTR measures how interesting your ad is, Cost Per Click (CPC) measures how efficient it is. This KPI tells you exactly what you're paying for every single click your campaign generates. It's an absolutely essential metric for keeping your budget in check and making sure you aren't just throwing money away to get people to your site.
Here’s how you calculate it:
CPC = Total Ad Spend / Total Clicks
Practical Example: Let's say you spent $150 on an ad that got those 300 clicks. Your CPC would be $0.50. Actionable Insight: Keeping a close watch on this helps you understand the real-world cost of attracting a visitor. If you see your CPC starting to creep up, it could mean your ad creative is getting stale (ad fatigue) or competition for your target audience is heating up. Try refreshing your ad image or targeting a different, but still relevant, subreddit to see if you can bring the cost back down.
Impressions and Engagement Signals
Impressions are just the total number of times your content was displayed on someone's screen. On its own, it's a bit of a vanity metric, but it’s the foundation for calculating more meaningful KPIs like your CTR.
But on a platform like Reddit, you can dig a lot deeper. Look at these engagement signals as powerful clues that you’ve captured genuine interest:
- Post Upvotes: Think of an upvote as a stamp of approval from the community. A post with a lot of upvotes is seen as valuable and relevant, which is exactly what you want.
- Comment Velocity: This is all about how quickly comments are piling up on your post. A fast and furious comment section means you’ve sparked a real conversation and hit on a topic people care about.
These top-funnel metrics are your first line of defense. By tracking them closely, you can get a read on your campaign's health right from the start and make smart adjustments to pull your audience in before they even see a landing page.
Mid-Funnel KPIs: How to Spot a Quality Lead
Alright, you've snagged some attention at the top of the funnel. Now comes the hard part: turning that initial spark of interest into something real. This is where we move from just counting clicks to actually judging the quality and efficiency of your lead pipeline.
These mid-funnel KPIs are your first true gut-check. They’re the canary in the coal mine, telling you whether the audience you're attracting from Reddit is the right one and if your campaigns are actually generating viable prospects without burning through your budget.
Conversion Rate
Your Conversion Rate is simply the percentage of people who land on your page and actually do the thing you want them to do. Think of it as the ultimate measure of how compelling your offer and landing page are. If this number is low, it’s a massive red flag that there's a disconnect somewhere between the ad they clicked and the form they're supposed to fill out.
The math is simple:
Conversion Rate = (Number of Conversions / Total Visitors) x 100
Practical Example: Let's say a Reddit ad sends 1,000 visitors to your landing page for a free ebook. Out of those, 50 people fill out your form. Boom—your conversion rate is 5%. Actionable Insight: If your conversion rate is low, review the user experience. Does your ad promise a "Complete Guide to SEO" but the landing page just offers a "Free SEO Checklist"? That mismatch in expectations is a conversion killer. Ensure the message, offer, and design are perfectly aligned between the ad and the landing page.
Cost Per Lead (CPL)
If conversion rate is about effectiveness, then Cost Per Lead (CPL) is all about efficiency. This KPI cuts right to the chase: how much money are you shelling out for every single lead you generate? For anyone managing a budget, this metric is non-negotiable.
Here’s how you figure it out:
CPL = Total Campaign Spend / Total Leads Generated
Practical Example: So, if you spent $500 on that same Reddit campaign and got those 50 leads, your CPL is $10. Actionable Insight: This number is everything. The dream scenario is a low CPL paired with a high conversion rate. If your CPL is too high, look at where the money is going. Are you targeting an overly competitive, expensive keyword? Could you target a more niche subreddit where clicks are cheaper but the audience is just as relevant? Adjusting your targeting is one of the fastest ways to lower CPL.
MQL vs SQL: The Critical Distinction
Let’s be honest: not all leads are created equal. This is where you absolutely have to understand the difference between a Marketing Qualified Lead (MQL) and a Sales Qualified Lead (SQL). Getting this right is what keeps your sales team from chasing down people who are just window shopping.
- Marketing Qualified Lead (MQL): This is someone who has kicked the tires. They've downloaded a whitepaper or signed up for your webinar. They're interested, but they're not ready for a sales call just yet.
- Sales Qualified Lead (SQL): This is the real deal. An SQL has been vetted and shows clear signs they're ready to talk business. They're requesting a demo, asking for a price quote, or starting a free trial. They’ve raised their hand and said, "I'm ready."
A rock-solid process for moving leads from MQL to SQL is the backbone of any successful sales funnel. To do that, you need to know exactly who you're looking for. To dig deeper on this, check out our guide on how to build your ideal customer profile.
Practical SaaS Example: A user who reads your blog and downloads an ebook about "Improving Team Productivity" is an MQL. They’re curious about the problem you solve. But when that same user later visits your pricing page and then requests a personalized demo? That's your SQL. Their actions are screaming purchase intent.
By tracking these mid-funnel KPIs, you stop guessing and start building a predictable system for qualifying leads. This ensures your sales team spends their precious time only on the opportunities that have a real shot at closing.
Bottom-Funnel KPIs That Prove ROI
While clicks and sign-ups feel good, they don't actually pay the bills. This is where we stop talking about marketing costs and start talking about marketing investment. Your bottom-of-the-funnel (BoFu) KPIs are where the rubber meets the road, connecting every Reddit upvote and lead magnet download directly to the bottom line.
These are the numbers that grab the attention of your CEO and CFO. They answer the one question that truly matters: "Is this making us money?" Getting a handle on these KPIs is how you prove your campaigns are delivering real, measurable return on investment.
Customer Acquisition Cost (CAC)
First up is your Customer Acquisition Cost (CAC). Put simply, this is what it costs you, on average, to land one new paying customer. It's not just your ad spend—it’s the total cost of your sales and marketing machine (salaries, software, overhead) divided by the number of new customers you brought in over a set period.
CAC = (Total Sales & Marketing Costs) / (Number of New Customers)
Practical Example: Let's say your total sales and marketing spend was $5,000 last quarter, and that effort brought in 10 new customers. Your overall CAC is $500. Actionable Insight: To make CAC even more useful, calculate it on a per-channel basis. If you find your Google Ads CAC is $800 but your Reddit campaign CAC is only $350, you have a clear data point suggesting where to allocate more of your budget next quarter for more efficient growth.
Customer Lifetime Value (LTV)
If CAC tells you the cost to get a customer through the door, Customer Lifetime Value (LTV) tells you how much they're worth once they're inside. This KPI measures the total revenue a single customer is expected to generate throughout their entire relationship with your business.
A high LTV is a sign you're not just making sales; you're building a base of loyal, valuable customers who fuel sustainable, long-term growth.
LTV = (Average Revenue Per Account) x (Customer Lifetime)
Practical Example: If your average SaaS customer pays $100 per month and sticks around for 36 months, their LTV is a healthy $3,600. Actionable Insight: LTV is a powerful lever for growth. You can increase it without acquiring any new customers. By focusing on customer success and introducing a new feature or pricing tier, you might increase that average customer lifetime from 36 to 42 months. That single change boosts your LTV to $4,200, making your entire marketing model more profitable.
As a lead moves from being marketing-qualified to sales-qualified, their potential LTV becomes much more tangible.
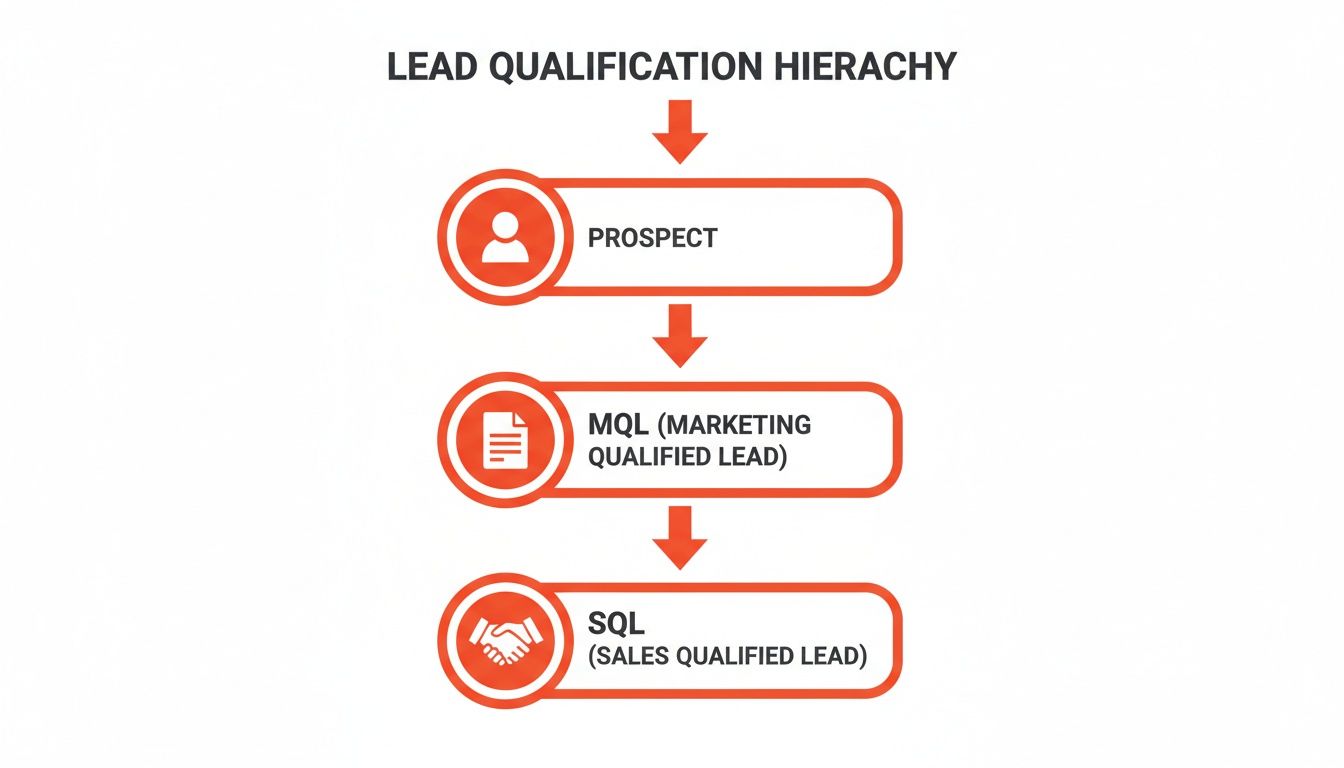
This flowchart shows how as a lead's intent and qualification level rise, so does their value to your business.
The LTV to CAC Ratio
The real magic happens when you bring these two metrics together. The LTV:CAC ratio is the ultimate health check for your business model, revealing how much value you generate for every single dollar you spend to acquire a customer.
A healthy SaaS business typically aims for an LTV:CAC ratio of 3:1 or higher. In other words, for every dollar you spend to get a customer, you should be making at least three dollars back over their lifetime.
If your ratio dips below 1:1, you're actively losing money on every new customer you sign. On the flip side, a ratio of 5:1 or more is fantastic, but it might actually signal that you're underinvesting in growth and could be acquiring customers even faster.
While B2B marketers often praise platforms like LinkedIn—which is reportedly 277% more effective for lead generation than Facebook and Twitter—Reddit offers a different kind of edge. It allows you to connect with high-intent communities much earlier in their buying journey, building trust and influence long before they're even thinking about a sales call. You can explore more lead generation stats here to see how different channels stack up.
Building Your Actionable KPI Dashboard
Tracking your lead generation key performance indicators is only half the battle. The real magic happens when you turn a jumble of raw numbers from a spreadsheet into a command center—a simple, actionable dashboard that tells you your campaign’s health at a single glance.
This isn’t about building some overwhelming, complex report that gathers digital dust. It's about creating a tool you'll actually want to use. A great dashboard tells a clear story, connecting the dots from your top-of-funnel Reddit ads all the way to bottom-line revenue.
Designing Your Dashboard Template
Your dashboard should be built around your goals, not just a laundry list of metrics. Start by asking, "What does success look like this quarter?" Maybe you're aiming for a specific number of SQLs. Or perhaps the goal is to slash your CAC by 15%. When you set a target, every KPI suddenly has a purpose.
With your goals locked in, create a simple table in a spreadsheet. This makes it incredibly easy to compare your actual performance against your targets and spot trends as they develop.
A dashboard isn’t just for reporting what happened; it’s for understanding why it happened. It turns passive data collection into an active tool for making smarter marketing decisions.
This kind of setup lets you see immediately if a campaign is on track, killing it, or falling behind. Think of it as your early warning system for everything from ad fatigue on Reddit to a jam in your sales handoff process.
A Practical Reddit Campaign Dashboard Template
Here’s a no-fuss template you can copy and paste right into a spreadsheet. It’s designed to track a Reddit-focused campaign from the first impression all the way through to revenue.
| Metric | Last Month | Current Month | Target | Notes & Insights |
|---|---|---|---|---|
| Reddit Ad Spend | $1,500 | $1,500 | $1,500 | Consistent budget allocation. |
| Impressions | 80,000 | 95,000 | 85,000 | ↑ Increased reach in r/saas. |
| Click-Through Rate (CTR) | 1.8% | 1.5% | 2.0% | ↓ CTR dropped; time to refresh ad creative. |
| Cost Per Click (CPC) | $2.10 | $2.50 | $2.00 | ↑ CPC rising, likely due to lower CTR. |
| Landing Page Conversions | 90 | 75 | 100 | ↓ Conversions down; need to investigate page. |
| Cost Per Lead (CPL) | $16.67 | $20.00 | $15.00 | ↑ CPL increased; efficiency is down. |
| MQLs Generated | 45 | 35 | 50 | ↓ MQLs are below target. |
| SQLs Generated | 12 | 8 | 10 | ↓ SQLs are critically low this month. |
| Customer Acquisition Cost (CAC) | $375 | $500 | $400 | ↑ CAC is 33% over target. Urgent issue. |
| Comment Sentiment | Positive | Mixed | Positive | Seeing negative comments on pricing. |
This template does more than just present numbers. That "Notes & Insights" column is where the real work gets done. It’s where you add context, like noticing that a dip in conversions lines up with a few negative comments about pricing on Reddit. This blend of hard data and human observation is what tells the full story.
For a deeper dive into the financial side of things, check out our guide on measuring return on marketing investment. With a dashboard like this, you stop just knowing your KPIs and start using them to grow.
Got Questions About Lead Gen KPIs? We've Got Answers.
Diving into lead generation metrics can feel like a lot. Let's be honest, it brings up questions for everyone. This is where we'll tackle some of the most common hurdles marketers face, giving you straightforward, practical answers to put your tracking strategy into action.
Think of this as your go-to field guide. It's all about moving from theory to what actually works day-to-day, helping you fine-tune your approach and really get the most out of your data.
How Often Should I Actually Look at My KPIs?
There’s no one-size-fits-all answer here. The right rhythm for checking your metrics depends on what you're measuring and how long your sales cycle is. You wouldn't obsessively check your retirement account every morning, but you might glance at the stock market. KPIs are a lot like that.
Daily or Weekly Peeks: For fast-moving, top-of-funnel metrics on live campaigns, you need to keep a close eye. Things like Click-Through Rate (CTR) and Cost Per Click (CPC) demand frequent checks, especially on a platform like Reddit. This lets you make quick tactical tweaks to your ads or targeting before you waste your budget.
Weekly or Bi-Weekly Check-ins: Metrics that live in the middle of your funnel, like Cost Per Lead (CPL) and the total number of Marketing Qualified Leads (MQLs), are perfect for a weekly review. This timing is the sweet spot—it helps you see trends in lead quality and campaign performance without getting sidetracked by tiny, meaningless daily fluctuations.
Monthly or Quarterly Deep Dives: Big-picture, bottom-funnel KPIs are best saved for a monthly or quarterly analysis. We're talking about Customer Acquisition Cost (CAC) and Customer Lifetime Value (LTV). These numbers need more time and data to tell you a meaningful story about your company's long-term health and profitability.
The key is to set a consistent schedule and stick to it. That's how you make smart, informed decisions instead of just reacting.
What’s a "Good" Conversion Rate, Anyway?
This question comes up all the time, and the real answer is... it depends. There is no magic number. Conversion rates are incredibly specific to your situation—your industry, the channel you're using, what you're offering, and how ready your audience is to buy.
A simple checklist download might hit a 15% conversion rate, and that's great. But for a complex B2B software demo, a 2% conversion rate could be a massive win.
Instead of getting hung up on vague industry averages, the single most important benchmark is your own past performance. The goal should always be to improve on what you've done before.
Actionable Insight: Instead of asking "what's a good conversion rate?", ask "how can I improve my conversion rate?" Run an A/B test on your landing page's call-to-action button. Test "Get Started" vs. "Request a Demo" or change the button color from blue to orange. A small tweak can sometimes lead to a significant lift, and that’s a real, measurable win for your business.
How Can I Possibly Track Leads from a Place like Reddit?
Attribution from channels like Reddit—which don't have a simple tracking pixel you can just install—requires a bit of deliberate setup. You can't just drop a link and cross your fingers.
Your absolute, non-negotiable first step is using UTM parameters on every single link you post. This is the foundation of accurate tracking.
Here’s a solid, layered strategy to get it right:
- Get Granular with UTMs: Create unique UTM codes for everything. We mean for each campaign (
utm_campaign=q3-ebook-launch), each subreddit you post in (utm_source=reddit&utm_medium=r-projectmanagement), and even each different ad creative (utm_content=blue-graphic-ad). This allows you to slice and dice the data in Google Analytics and see precisely which of your efforts are paying off. - Just Ask: Add an optional "How did you hear about us?" field to your sign-up forms. Make sure "Reddit" is one of the choices. You’d be surprised how many people will tell you exactly where they came from.
- Create a Dedicated Welcome Mat: For your biggest campaigns, spin up a unique landing page used only for your Reddit traffic. This makes attribution dead simple—if a lead came from that page, it came from Reddit.
When you combine these methods, you get a much clearer, more confident picture of the real impact your Reddit marketing is having.
Ready to turn Reddit's passionate communities into a reliable stream of qualified leads? The team at Reddit Agency lives and breathes this stuff. We build authentic campaigns that drive real, measurable results, handling all the strategy, content, and engagement so you can focus on what you do best: turning great prospects into happy customers. Book a call with us today and let's build your Reddit growth engine together.